Discover the Acea Group online 2019 Sustainability Report
Analysis of Procurements and the supply chain
SCOPE OF REFERENCE
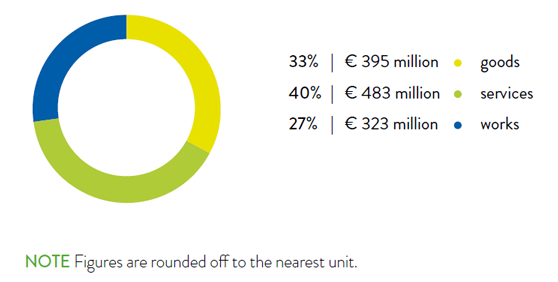
Tenders for the supply of goods, the performance of services and the completion of works, for the companies included in the reporting – with the exception of Gesesa and Gori84 – were managed at a centralized level. As initially mentioned, contracts awarded during the year had a comprehensive financial value of approximately € 1.2 billion85, 23% more than the 974 million in the previous year. The absolute values of the items goods and services increased compared to 2018, while works decreased (see table no. 34).
CHART NO. 29 – VALUE OF PROCUREMENT OF GOODS, SERVICES AND WORKS AND PERCENTAGE ON TOTAL (2019)

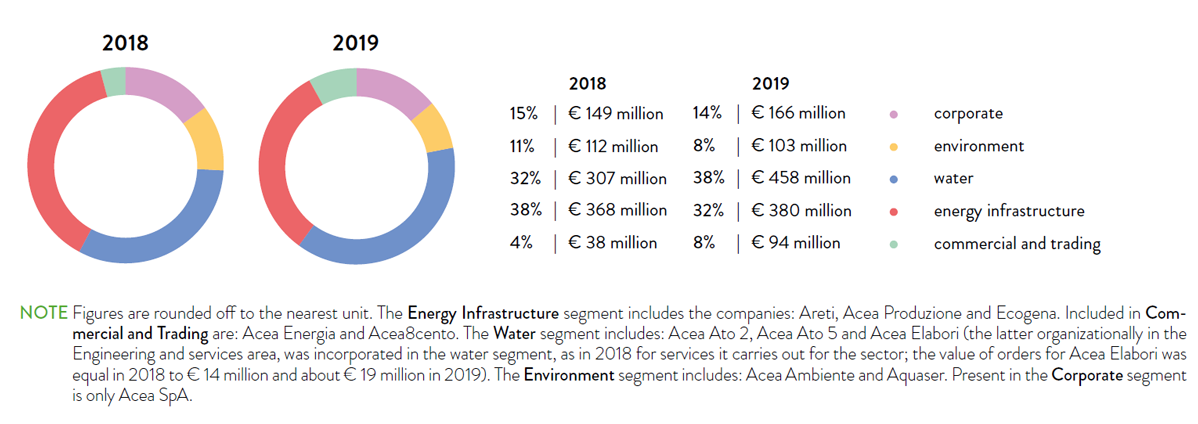
Analysing the procurement values for the business macro areas –Energy Infrastructure (generation and networks), Commercial and Trading (sales and call centres), Water (including Acea Elabori, for services provided to the sector), Environment (waste-to-energy and environmental services) and Corporate (Acea SpA) – the largest changes compared to the previous year were recorded for the Water segment (+49%), to be correlated in particular with the increase in orders for “works”, and for Commercial and Trading (+150%), for “goods and services” orders. The largest percentage of total procurements is related to the Water (38%) and Energy Infrastructure (32%) segments (see chart no. 30 and table no. 34).
CHART NO. 30 – ORDERS (GOODS, SERVICES, WORKS) BY BUSINESS AREA (2018-2019)

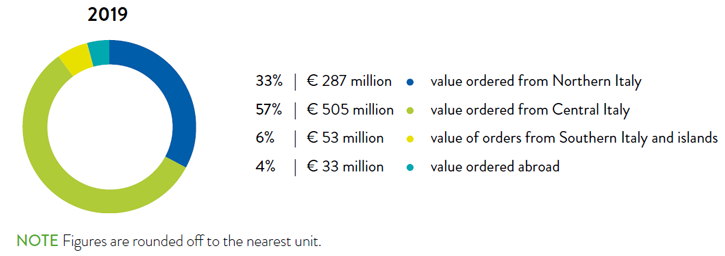
CHART NO. 31 – GEOGRAPHICAL DISTRIBUTION OF THE AMOUNTS USED FOR THE PURCHASE OF GOODS AND SERVICES IN ITALY AND ABROAD (2019)

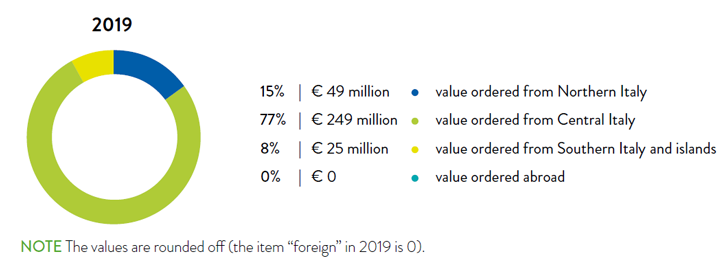
CHART NO. 32 – GEOGRAPHICAL DISTRIBUTION OF THE AMOUNTS OF WORKS AWARDED IN ITALY AND ABROAD (2019)

The companies Gori and Gesesa, operating in the water sector in Campania, managed their procurements for the year independently, so the data presented here is not in aggregate form. More specifically, the value of Gori’s 2019 procurements was equal to a total of approximately € 75 million (6 million for the procurement of goods, 66 million for services and 3 million for works), for a total of 1,068 Purchase Orders managed. Regarding Gesesa, 2019 procurements totalled approximately € 12 million (5 million for goods, 2 million for services and 5 million for works), up approximately 50% compared to the previous year (8 million in 2018), for a total of 756 Purchase Orders managed. Total procurements of Gesesa involved 186 suppliers, more than 70% of which concentrated in southern Italy and the islands, while 1% abroad, 14% in central Italy and 15% in northern Italy. This concentration, the effect of a natural proximity of operations to the local region, is also reflected in the percentage distribution of the amounts of goods and services and works, also focused in the southern Italy and islands area, for about 66% and about 78% respectively.
TABLE NO. 34 – PROCUREMENT NATIONWIDE (2017-2019)
| m.u. | 2017 | 2018 | 2019 | % 2019/2018 | |
| VALUE OF CONTRACTS | |||||
| goods | million € | 137 | 267 | 395 | 48% |
| services | million € | 304 | 333 | 483 | 45% |
| works | million € | 153 | 374 | 323 | -14% |
| total | million € | 594 | 974 | 1,201 | 23% |
| GOODS, SERVICES AND WORKS AS A PERCENTAGE OF TOTAL ORDERS | |||||
| goods | % | 23 | 28 | 33 | 18% |
| services | % | 51 | 34 | 40 | 18% |
| works | % | 26 | 38 | 27 | -29% |
| VALUE OF ORDERS BY BUSINESS AREA | |||||
| Energy Infrastructure | million € | 169 | 368 | 380 | 3% |
| Commercial and Trading | million € | 41 | 38 | 94 | 147% |
| Water | million € | 136 | 307 | 458 | 49% |
| Environment | million € | 110 | 112 | 103 | -8% |
| Corporate | million € | 138 | 149 | 166 | 11% |
| NUMBER OF PURCHASE ORDERS MANAGED | |||||
| POs for goods, services and works | no. | 2,073 | 2,195 | 2,843 | 30% |
NOTE All the figures in the table are rounded off to the nearest unit. The data of Gori and Gesesa are not included. Where available, they are presented in the text. Acea Elabori, organizationally part of the Engineering and services area, was incorporated in the Water area in the table, for the services it carries out for the sector.
TABLE NO. 35 – PROCUREMENT NATIONWIDE (2017-2019)
| u.m. | 2017 | as % of total/year | 2018 | as % of total/year | 2019 | as % of total/year | ||||
| NUMBER OF SUPPLIERS OF GOODS, SERVICES AND WORKS NATIONWIDE | ||||||||||
| suppliers north Italy | no. | 356 | 33% | 385 | 34% | 484 | 33% | |||
| suppliers central Italy | no. | 620 | 58% | 657 | 57% | 836 | 57% | |||
| suppliers Lazio | no. | 489 | 46% | 518 | 45% | 654 | 45% | |||
| suppliers south Italy and islands | no. | 74 | 7% | 84 | 7% | 110 | 8% | |||
| foreign suppliers | no. | 19 | 2% | 25 | 2% | 32 | 2% | |||
| total suppliers | no. | 1,069 | 100% | 1,151 | 100% | 1,462 | 100% | |||
| TOP 10 SUPPLIERS OF GOODS, SERVICES AND WORKS (amounts awarded) | ||||||||||
| TOP 10 suppliers of goods | million € | 52 | 38% (on total amount of goods 2017) | 97 | 36% (on total amount of goods 2018) | 244 | 62% (on total amount of goods 2019) | |||
| TOP 10 suppliers of services | million € | 129 | 42% (on total amount of services 2017) | 105 | 32% (on total amount of services 2018) | 175 | 36% (on total amount of services 2019) | |||
| TOP 10 suppliers of works | million € | 65 | 42% (on total amount of works 2017) | 248 | 66% (on total amount of works 2018) | 160 | 49% (on total amount of works 2019) | |||
| GEOGRAPHICAL BREAKDOWN OF AMOUNTS FOR GOODS AND SERVICES | ||||||||||
| value ordered from Northern Italy | million € | 213 | 48% | 297 | 49% | 287 | 33% | |||
| value ordered from Central Italy | million € | 198 | 45% | 251 | 42% | 505 | 57% | |||
| value ordered from Lazio | million € | 160 | 36% | 191 | 32% | 385 | 44% | |||
| value of orders from southern Italy and islands | million € | 22 | 5% | 39 | 7% | 53 | 6% | |||
| value ordered abroad | million € | 8 | 2% | 13 | 2% | 33 | 4% | |||
| total value of orders for goods and services | million € | 441 | 100% | 600 | 100% | 878 | 100% | |||
| GEOGRAPHICAL BREAKDOWN OF AMOUNTS FOR WORKS | ||||||||||
| value ordered from Northern Italy | million € | 37 | 24% | 78 | 21% | 49 | 15% | |||
| value ordered from Central Italy | million € | 99 | 65% | 279 | 75% | 249 | 77% | |||
| value ordered from Lazio | million € | 90 | 59% | 120 | 32% | 242 | 75% | |||
| value of orders from southern Italy and islands | million € | 12 | 8% | 16 | 4% | 25 | 8% | |||
| value ordered abroad | million € | 5 | 3% | 1 | 0% | 0 | 0% | |||
| total ordered for works | million € | 153 | 100% | 374 | 100% | 323 | 100% | |||
NOTE All the figures in the table are rounded off to the nearest unit. The data of Gori and Gesesa are not included. Where available, they are presented in the text. The “northern Italy” geographical area includes Valle d’Aosta, Piedmont, Lombardy, Veneto, Trentino-Alto Adige, Friuli Venezia Giulia, Emilia-Romagna and Liguria; “central Italy” includes Tuscany, Umbria, Marche, Lazio, Abruzzo and Molise; “southern Italy and islands” includes Campania, Basilicata, Apulia, Calabria, Sicily and Sardinia. The geographical location “foreign”, active in 2019 only for the item “goods and services”, includes suppliers that are mainly European.
84 The data relating to the supply of the companies operating in the water sector Gori and Gesesa, managed independently by the Companies, are not present in the analysis of the aggregated data, but are reported later in the chapter.
85 The amount refers to tenders awarded during the year, without any distinction between investments and operating cost, annual and multi-annual contracts. Purchases of commodities, regularisation orders and intercompany orders are excluded.