Discover the Acea Group online 2019 Sustainability Report
Quality delivered
Acea is committed to the progressive and constant improvement of the overall quality of the services provided, with adequately trained and updated staff to:
- improve process efficiency;
- renovate or expand infrastructure (networks and installations);
- provide effective and timely repairs in the event of faults;
- manage communications, commercial aspects and diversify customer contact channels.
The “quality delivered” is also measured on the basis of reference parameters established by the sector Authorities or indicated in the service contracts and management agreements with local authorities, specifically:
- for the Public Lighting service, the contract between Acea and Roma Capitale regulates the qualitative parameters (performance standards);
- the technical and commercial quality standards in the energy sector (for both distribution and sales) and for the contractual and technical quality of the integrated water service are established and regulated by the Regulation Authority for Energy, Networks and the Environment (ARERA) and, for the water sector alone, also by the local Authorities.
The main regulatory interventions of ARERA in 2019 for the electricity and water sectors are briefly illustrated in the Group Profile chapter, in the paragraph Context analysis and business model, to which reference is made. Here, it should be noted that for the water service from 1 January 2019 operators are subject to the obligations of recording and archiving technical quality data and that the Authority partially expanded the incentive mechanism envisaged by its own year-end measure. For the energy distribution and sales service, the Authority provided incentive mechanisms on interventions aimed at making the networks more resilient, and in 2019 published interventions relating to the 2019-2021 plans of distributors – including Areti SpA – eligible for bonuses and/or penalties. With regard to the sale of electricity, it should be noted that the end of the standard market service for the more than 16 million families still present in this market segment was postponed from 1 July 2020, as previously planned, to 1 January 2022.
In addition to regulatory measures, the UNI EN ISO certified management systems used by the companies for some time now, based, as is well known, on a logic of continuous improvement, have contributed to increasing the quality of the services provided (see also Company identity, paragraph Management systems).
QUALITY IN THE ENERGY AREA
This section illustrates the quality aspects related to electricity distribution services in the municipalities of Rome and Formello, and Public Lighting in the municipality of Rome, both managed by Areti35, while for the sale of electricity see the paragraph on Customer Care.
The Company operates in compliance with the QASE (Quality, Environment, Safety and Energy) Management System for both the construction and management of distribution infrastructure and Public Lighting.
THE DISTRIBUTION OF ELECTRICITY

Areti plans and carries out modernisation and expansion works on the electricity distribution network, comprising high, medium and low voltage electricity lines, stations and substations, systems for remote control and for measuring electricity drawn from and fed into the grid..
The interventions take into account the objectives established by the National Authority (ARERA), the progressive evolution of electricity applications, the increase in “prosumers”, new connections and other factors that indicate the need for increasingly resilient infrastructure, with an adequate and enabling network configuration for future scenarios.
The Regulatory Plans of the HV, MV and LV grids are the operational tool for the integrated development of the electricity grids, and every year Areti implements them with interventions of construction (and also dismantling or demolition and consequent reduction of environmental impacts in specific areas), transformation, modernisation, maintenance, etc., with the main projects being illustrated in table no. 17.
These interventions are necessary to rationalize and upgrade networks, expanding transport capacity and margins for further use, increasing the resilience of infrastructure and reducing network losses and voltage drops, improving the continuity of service. In 2019, as part of the implementation of the Resilience Plan presented to ARERA in June, it is noted that 86 km of 20 kV medium-voltage cable were modernized and 33 renovations of substations were carried out to increase their resilience to the critical factor of “heat waves”, and there were 73 renovations of substations to increase their resilience to the critical factor of “flooding”. For LV networks, 282 km were installed as part of the overall network modernisation programme, preparatory to the subsequent voltage change from 230 V to 400 V. In addition, remote control was extended to a further 193 substations and 77 reclosers for a total of 6,994 remotely controlled MV nodes as at 31.12.2019.
TABLE NO. 17 – THE MAIN INTERVENTIONS FOR THE MANAGEMENT AND DEVELOPMENT OF NETWORKS AND ELECTRICAL SUBSTATIONS (2019)
| TYPE OF WORK | HV LINES AND STATIONS (CP) |
| Demolition of grid and supports | The demolition of the 150 kV Flaminia 2 – East Sorting 2 overhead line continued |
| Construction of grid and supports | The construction of the new section of the 150 kV Roma Nord – San Basilio overhead line continued (4.08 km long and composed of 21 supports). |
| Station upgrading, expansion, renovation | Interventions on 29 stations; The installation of Petersen system was continued at the Nomentano station and Villa Borghese in order to reduce grid losses |
| Ordinary end extraordinary maintenance on CP station equipment | Interventions on 107 HV switches and 942 MV switches maintained; Overhauled 17 variators under power transformer load; replaced 60 HV transformers (54 voltage and 6 current). |
| HV and MV protection and measures | |
| Electrical protection systems | Installed, calibrated and commissioned 53 new MV line stalls; checked 293 poles (57 HV poles and 236 MV poles) and 37 transformers (between HV/MV and MV/MV) |
| measurements | Ground resistance measurements on 2,783 substations Step and touch voltage measurements and total ground resistance measurements on 75 stations (24 CP and 51 CS) |
| MV and LV lines | |
| Modernisation and upgrading of MV networks (transformation from 8.4 kV to 20 kV) and LV networks (transformation from 230 V to 400 V) | Installed 272 km of 20 kV MV cables (12 km for expansion and 260 km for refurbishment), of which 86 km for increased resilience to “heat waves”; Installed 328 km of LV cable (46 km for expansion and 282 km for preliminary refurbishment for voltage change). |
| Ordinary and extraordinary maintanance | 124 extraordinary maintenance operations (replacement of equipment, supports, conductors, etc.) on MV overhead lines. |
| substations (CS) and remote control | |
| CS construction, expansion, renovation | Built/expanded/rebuilt 1,108 substations (99 for new connections or power increases, 1,009 for 20 kV voltage adjustment, equipment renovation, remote control), of which 106 substations were rebuilt for increased resilience to “heat waves” (33 stations) and “flooding” (73 stations). |
| ordinary and extraordinary maintenance on CS | 915 extraordinary maintenance operations and 2,602 inspections of substations. |
| Remote management | Extended to 193 CS and 77 reclosers (6,994 remotely controlled MV nodes as at 31.12.2019); 6,696 maintenance operations on TLCs and reclosers. |
As part of the strengthening of the central systems for remote control, in 2019 particular attention was paid to the issue of Cyber security. Following the results of the “security assessment” conducted on the technology underlying the Energy Infrastructure, a plan of interventions was defined in the operating (lines of communication with the outside world) and governance areas. It gave impetus to the definition of the first Cyber Security policies and the carrying out of Benefit Impact Assessments (BIA) and risk assessments.
The necessary documentation was prepared for the establishment of a Security Operation Centre (SOC) and activities have also been carried out to raise the level of cyber security of stations and substations. The year also saw the launch of the tender as part of the agreement between Acea and Open Fiber for the construction of the broadband communication network for the smart grid in the territory of Roma Capitale that envisages the connection of stations and substations with fibre optics.
See also the chapter Institutions and Business for an in-depth analysis of research and innovation and the projects implemented. With regard to digital meters and smart metering systems, in order to replace first-generation (1G) meters with second-generation (2G) meters, Areti launched a public tender for the supply of 2G devices and the most advanced central data acquisition system, which was awarded to Enel Global Infrastructure & Networks. The plan for mass replacement of 2G meters, approved by ARERA, will be launched starting in 2020 and progressively throughout the managed region of Rome and Formello for a total of about 1.7 million meters. The characteristics of the new meters give customers a number of opportunities and benefits, such as: the availability of data that promotes a greater awareness of consumption, with the consequent possibility of changing their habits for the purpose of saving energy, the reduction of estimated bills, the choice of commercial offers that are more suited to the needs of each, as well as the reduction of switching times.
Lastly, the installation of digital meters under remote management continued for low voltage users for a total of 1,635,163 meters installed on active low voltage users as at 31/12/2019, equal to 99.7% of the total LV meters.
PUBLIC LIGHTING

Under the Service Contract36 between Acea SpA and Roma Capitale, Areti employs a dedicated unit to manage works on the functional and monument artistic Public Lighting infrastructure with approximately 199,700 points of light located in a territory covering approximately 1,300 km2.
The Company carries out the design, construction, operation, maintenance and renovation of networks and lighting systems and plans work in accordance with the instructions given by local government and supervisory departments and authorities responsible for new urban developments, improvement projects and the cultural heritage. In addition to the service provided to Roma Capitale, Areti also makes public and artistic lighting services available to other stakeholders (e.g. ecclesiastical bodies, hotels, etc.).
TABLE NO. 18 – PUBLIC LIGHTING IN ROME IN FIGURES (2019)
| lighting points (no.) | 199,779 |
| Monumental artistic lighting points (no.) | about 9,900 |
| bulbs (no.) | 225,730 |
| MV and LV network (km) | 7,982 |
The overall power of the lamp inventory went from 17.83 MW in 2018 to 15.63 MW in 2019, with a clear reduction in consumption, while the average efficiency per lamp has increased. This is also due to the transformation of systems in recent years: in 2019 out of a total of 225,730 lamps, 205,670 – or about 91% of the total – use LED technology (see also the Environmental accounts).
Areti completed the “LED Plan for the Capital”, with the overall installation as at 31.12.2019 of more than 180,000 light fixtures, generating benefits in terms of energy savings and reduction of the effects of light dispersion. The effect of the LED transformation, especially in terms of general improvement of the lighting level, allowed the total number of light points to be limited. Indeed, during the year the balance between the new installed light points and the failure to reposition the existing ones even saw a slight decrease, with a reduction of 4 light points compared to the previous year. In addition, the second section of the Giovanni XXIII tunnel was transformed into LEDs as part of the plan approved by the Municipal Administration in 2017, as well as the new lighting of some parks, including Aqueduct Park, Romanina Park and Baden-Powell Park. A total of 228 poles and garden reinforcements were installed and more than 5 km of cables were laid (see the box for details).
NEW PARK LIGHTING
The project for the new lighting of the Aqueduct Park, located in the Appio Claudio district and part of the Appia Antica Regional Park, called for the installation of 68 5-metre poles with garden reinforcements, with a total installed power of 2,000 W, in addition to the laying of 2 km of cable. Before being approved, the project was subjected to progressive refinements and repeated review by MIBAC and the Park Authority, to minimize interference with the trees and ensure the full integration of the plants with the park’s archaeological area.
All excavation work was carried out under the supervision of an archaeologist to check for ruins in the subsoil and an agronomist to safeguard the existing trees. The system illuminates the pathways and the playground inside the park.
For Romanina Park in the Anagnina area, the project to expand the usability of the green area included two phases, the first managed by the SIMU department (Infrastructure Development and Urban Maintenance) and the second by Municipality VII, responsible for the area. The works, which lasted from July to November 2019, involved the installation of 102 poles and garden reinforcements, with a total power of 3,000 W and the laying of 1.7 km of cable.
For the new lighting of Baden-Powell Park in Colli Aniene, 58 poles and garden reinforcements were installed, with a total installed power of 1,300 W and the laying of 1.4 km of cable. Thanks to the synergy with the Garden Service Office of Roma Capitale, the initial project was revised both during the design and construction phases due to the considerable presence of the Common Pine. This involved an increase of the excavation section for the housing of the backbone and the shifting of a part of the plant to ensure less interference with the trees.
Numerous works of monumental artistic lighting have also led to the renovation of existing facilities at sites of cultural interest and high-traffic tourist attractions, including Trevi Fountain, Castel Sant’Angelo, the Colosseum, the Basilica of San Giovanni in Laterano and the Theatre of Marcello (see the box for details), contributing to enhance its beauty for the benefit of the local public and visitors.

Each year Acea carries out efficiency and safety operations on the light fixtures as well as scheduled and unscheduled maintenance on the systems (see table no. 19).
TABLE NO. 19 – MAIN INTERVENTIONS FOR IMPROVED EFFICIENCY, SAFETY, REPAIRS AND MAINTENANCE (2019)
| TYPE OF WORK | (QTY.) |
| Actions to improve energy efficiency/technological innovation (fixture replacement) | 12,200 lighting points |
| Safety measures | 3,512 lighting points |
| Checking corrosion on lamp posts | 33,009 supports verified (functional and artistic) |
| LED lamp reinforcement/maintenance | 7,075 interventions |
| Reinstalling lamp posts that were corroded or knocked down due | 1,521 lamp posts reinstalled |
NOTE The table includes operations carried out for the Municipality of Rome and third parties.
Acea monitors the quality parameters of the Public Lighting service with regard to fault repair times, calculated starting from the arrival of the notification37.
The service standards are expressed by an average admitted recovery time (TMRA), within which the repairs should take place and a maximum time (TMAX), after which a penalty system is activated38.
The average recovery time (TMR) for systems used by Acea in 2019 for the different types of faults (see table no. 20) fell within the average recovery time allowed.
TABLE NO. 20 – PUBLIC LIGHTING FAULT RECOVERY: FINES, STANDARDS AND ACEA PERFORMANCE (2018-2019)
| FAULT TYPE | FINE PER DAY OF DELAY | SERVICE LEVEL AGREEMENT(*) | ACEA PERFORMANCE | |||||
| (euro) | TMRA (avarage recovery time allowed) (working days) | TMAX (avarage recovery time allowed) (working days) | TMR (avarage recovery time allowed) (working days) | |||||
| 2018 | 2019 | |||||||
| Blacked out neighbourhood – MV grid failure | 70 | 1 day | 1 day | < 1 day | < 1 day | |||
| Blacked out street – MV or LV grid failure | 50 | 5 days | 8 days | 2.6 days | 1.9 days | |||
| Blacked out stretch (2-4 consecutive lights out) | 50 | 10 days | 15 days | 9.9 days | 8.4 days | |||
| Lighting points out: single lamps, posts, supports and armour | 25 | 15 days | 20 days | 9.3 days | 11.9 days | |||
(*) Consistent with previous years, data were monitored in compliance with provisions under Annex D/2 to the 2005-2015 Service Agreement between the Municipality of Rome and Acea SpA.
The fault is detected by control systems like remote management, and can be reported through the various contact channels (call centre, web, fax or letter)39. 23,537 fault reports were received in 201940 and 97% of them were dealt with by the end of the year.
The percentage distribution of reports by type of fault is shown in chart no. 24. The most significant incidents concern “blacked out street”, in relation to a network fault (51.5%) and “lighting point out” (25.4%), having the lowest impact in terms of safety, the “blacked out stretch” is more contained (12%). During the year there have been no cases of “Blacked out neighbourhood” due to grid failure.
CHART NO. 24 – TYPES OF PUBLIC LIGHTING FAULTS OUT OF TOTAL REPORTS RECEIVED (2019)

As mentioned, Acea contributes to the enhancement of the monumental heritage of the capital in agreement with the relevant authorities, with about 10,000 light fixtures for artistic lighting. The main interventions of the year, already mentioned at the beginning of the paragraph, are illustrated in a separate box.
RENOVATION OF LIGHTING FOR SOME OF THE MOST POPULAR MONUMENTS IN THE CAPITAL
In 2019 Areti intervened on some of the most important and well-known monumental sites of Rome, renewing the existing systems. In particular, with the support of Roma Capitale, the artistic lighting of Fontana di Trevi was renovated, with the replacement of 56 spotlights with LED technology. The lamps were inserted in strategic points of the monument to restore the accent lighting created by Acea in 2015. The plant has a total of 85 underwater spotlights and 6 spotlights on shelves, with a total power of only 2.1 kW, saving 70% of electricity.
The pointing of some spotlights installed on the shells behind the statue of Ocean highlights the central structure of the fountain, while the others inserted inside the basin and at the foot of the reef and the side statues bring out the details on the side of the central body. With this intervention the upper basin is once again fully illuminated. In Castel Sant’Angelo the artistic lighting system was renovated with 220 new spotlights between the Mole, Ponte Sant’Angelo and the five hectares of park surrounding the complex. In addition, part of the power lines have been restored and a new remote control technology has been introduced to remotely manage the operation of the spotlights and to remotely control the system in the event of failure.
Extraordinary maintenance was carried out on the Colosseum’s internal and external lighting system. Acea technicians worked at night in order not to compromise the usability of the monument by tourists, inspecting the 298 existing spotlights and replacing a total of 120. In particular, on the first level of arches, the restoration activities of the plant led to turning 65 spotlights back on and were carried out with the use of special machinery, progressively subdividing the areas of intervention. On the second level, the works on the lights located near the arches – for a total of 34 spotlights turned back on – were carried out inside and outside the monument, and from outside, through the use of mobile lifts. Finally, on the third level, 21 spotlights were switched back on from inside the monument. The renovation of the lighting system of the Marcello Theatre, located between the Tiber River and the Capitol, also affected the internal and external archaeological area of the monument, with the overall replacement of 115 spotlights.
The arches of the first and second level of the Marcello Theatre have been illuminated internally, as well as the archaeological remains located in the outdoor area, including the Corinthian columns of the Temple of Apollo Sosiano.
With the support of Roma Capitale and the Directorate of Infrastructure and Services of the territory governed by Vatican City, Areti intervened on the lighting system of the Basilica of San Giovanni in Laterano, the first and oldest of the four major papal basilicas, with the replacement of 106 spotlights, positioned to enhance the 18th-century architecture of the main façade and the 16 statues that overlook it. The works, completed in just ten days, also involved the northern façade of the Basilica, the two medieval bell towers, the portico and the frescoed loggia with sacred images.
Finally, again in 2019, thanks to a private donation, the lighting system of the Immacolata column of Piazza Mignanelli was built based on a project conceived by the master Vittorio Storaro, with the installation of 29 energy-saving hi-tech LED lighting fixtures for a total consumption of only 1 kW. The new LEDs were positioned in accordance with the Special Archaeological Superintendence, Fine Arts and Landscape of Rome and the Capitoline Superintendency for Cultural Heritage, within a perimeter formed by deterrents placed around the column with lighting fixtures and spotlights inserted in special recesses that depressions that minimize their visual impact to leave the view of the monument unobstructed.

THE QUALITY LEVELS REGULATED BY ARERA IN THE ELECTRICITY SECTOR
The Regulatory Authority for Energy Networks and Environment (ARERA) defines national standards for the commercial quality (quotes, works, supply activation/deactivation, responses to complaints) and technical aspects (supply continuity) of the electrical service. It reviews them on a regular basis, making them more stringent, stimulating operators to constantly improve their performance.
The commercial quality consists of “specific” levels and “general” levels41, applicable to the operations pertaining to the distribution company (divided into low and medium voltage supplies) as well as those of the seller (see tables no. 21, 22 and 23). Every year Acea reports the results achieved to ARERA for review and discloses them to its own customers by enclosing them in the bill.
For the commercial and technical quality performance in 2019, related to the distribution and measurement of electricity, we present data produced with the best estimate available42, which may differ from those sent to the Authority (ARERA) according to the deadlines set by the same.
As regards the “specific” commercial quality levels, for low voltage supplies to domestic customers and for medium voltage supplies, in many cases there was a slight improvement in performance. With regard to the “general” levels of responses to written complaints/requests for information, there was a substantial improvement in performance compared to 2018 for the distribution service and a worsening in the metering service (see table no. 21).
The automatic indemnities43 to be granted to customers in the event of failure to comply with “specific” quality levels start from a basic amount44, which can either double (when operations are performed in a timeframe between twice and three times the required standard) or treble (if operations are performed in a timeframe three times the required standard). For aspects relating to the quality of the sales service, it should be noted that in 2019 more stringent parameters for some services came into force. During the year, Acea Energia aligned the processing of written complaints with the volumes currently being received, thus reducing the backlog to a so-called “normal” quantity. This has led to the continued high level of compliance with the standards established by ARERA, also in the face of the significant reduction in the time limits within which to perform the services (see table no. 22) and a reduction in the amount of compensation to be paid to end customers.
Areti’s 2019 performance related to the “technical” quality of the service 45 (continuity of electricity supply), published here, is not the same as what is communicated to ARERA46 but rather the best estimate available.
With regard to the duration of disruptions and the number of disruptions for LV users, the data concerning 2019 and shown in table no. 23 indicate that in areas of high concentration, i.e. the urban environment where most users of Areti are located, continuity of service was guaranteed with the same quality as 2018. On the other hand, there is a decline in results in peripheral and rural areas.
Disruptions occurring at any voltage level within the electricity system are also regulated for MV customers.
The regulatory system entitles medium-voltage customers to receive automatic compensation provided that they can certify the adequacy of their systems47 in the event of a number of disruptions in the supply of electricity exceeding that stated by a specific standard.
Prolonged or extended disruptions, in other words service disruptions exceeding the duration established by standards, are also regulated for both LV customers and MV customers. In such eventualities, the operator is required to pay a fine, calculated on the basis of the number of LV customers cut off as a result of disruptions due to “other causes”, to the extraordinary event fund set up with the Energy and Environmental Services Fund. In addition, the distributor will automatically indemnify customers affected by disruptions.
TABLE NO. 21 – MAIN SPECIFIC AND GENERAL LEVELS OF COMMERCIAL QUALITY – ENERGY DISTRIBUTION (2018-2019) – (ARERA parameters and Areti performance – 2018: data submitted to ARERA; 2019: estimated data)
| ENERGY DISTRIBUTION | |||||
| SPECIFIC LEVELS OF COMMERCIAL QUALITY | |||||
| SERVICES | ARERA PARAMETERS – MAX. TIME FOR SERVICE DELIVERY | Service delivery average actual time | Percentage of services carried out within time limit | Service delivery average actual time | Percentage of services carried out within time limit |
| 2018 | 2019 | ||||
| LOW VOLTAGE (LV) SUPPLIES | |||||
| DOMESTIC CUSTOMERS | ARETI’S PERFORMANCE | ||||
| estimates for work on LV networks (ordinary connections) | 15 working days | 7.18 | 96.80% | 7.35 | 97.17% |
| completion of simple work (ordinary connections) | 10 working days | 8.05 | 86.02% | 8.29 | 85.62% |
| completion of complex works | 50 working days | 16.09 | 94.51% | 15.13 | 96.74% |
| supply activation | 5 working days | 1.82 | 96.33% | 1.42 | 96.53% |
| deactivation of supply on customers request | 5 working days | 1.18 | 98.42% | 0.86 | 98.47% |
| reactivation of supply following disconnection for late payment | 1 working day | 0.15 | 99.10% | 0.21 | 99.33% |
| resumption of the supply following faults of the metering equipment (requests sent during business days from 08:00 to 18:00) | 3 hours | 2.40 | 78.49% | 2.18 | 81.42% |
| resumption of the supply following faults of the metering equipment (requests sent during business days from 08:00 to 18:00) | 4 hours | 2.55 | 88.20% | 2.25 | 89.87% |
| maximum punctuality band for appointments with customers | 2 hours | n.a. | 80.67% | n.a. | 87.30% |
| NON-DOMESTIC CUSTOMERS | ARETI’S PERFORMANCE | ||||
| estimates for work on LV networks (ordinary connections) | 15 working days | 7.29 | 96.49% | 7.58 | 96.46% |
| completion of simple work (ordinary connections) | 10 working days | 7.79 | 87.14% | 9.74 | 84.14% |
| completion of complex works | 50 working days | 16,31 | 94.49% | 15.46 | 94.38% |
| supply activation | 5 working days | 2.13 | 94.97% | 2.60 | 92.18% |
| deactivation of supply on customers request | 5 working days | 7.72 | 93.63% | 8.65 | 94.68% |
| reactivation of supply following disconnection for late payment | 1 working day | 0.18 | 98.78% | 0.41 | 98.88% |
| resumption of the supply following faults of the metering equipment (requests sent during business days from 08:00 to 18:00) | 3 hours | 2.84 | 72.84% | 2.52 | 75.68% |
| resumption of the supply following faults of the metering equipment (requests sent during business days from 08:00 to 18:00) | 4 hours | 2.72 | 86.80% | 2.51 | 89.22% |
| maximum punctuality band for appointments with customers | 2 hours | n.a. | 81.73% | n.a | 89.50% |
| MEDIUM VOLTAGE SUPPLIES (MV) | |||||
| FINAL CUSTOMERS | ARETI’S PERFORMANCE | ||||
| estimates for work on MV networks | 30 working days | 18.65 | 83.08% | 15.92 | 91.40% |
| completion of simple work | 20 working days | 5.27 | 100.00% | 6 | 100.00% |
| completion of complex works | 50 working days | 18.19 | 95.24% | 23.92 | 95.12% |
| supply activation | 5 working days | 7.14 | 64.29% | 5.31 | 71.88% |
| deactivation of supply on customers request | 7 working days | 29.71 | 61.29% | 10.50 | 73.08% |
| reactivation of supply following disconnection for late payment | 1 working day | 1.53 | 82.35% | 0.81 | 81.82% |
| maximum punctuality band for appointments with customers | 2 hours | n.a. | 90.76% | n.a. | 83.33% |
| GENERAL LEVELS OF COMMERCIAL QUALITY | |||||
| SERVICES | ARERA PARAMETERS – MINIMUM PERCENTAGE OF SERVICES TO BE PERFORMED WITHIN A MAXIMUM TIME | Service delivery average actual time | Percentage of services performed within the maximum time. | Service delivery average actual time | Percentage of services performed within the maximum time |
| 2018 | 2019 | ||||
| LOW VOLTAGE (LV) SUPPLIES | |||||
| DOMESTIC CUSTOMERS | ARETI’S PERFORMANCE | ||||
| reply to written complaints/enquiries regarding distribution operations | 95% within 30 calendar days | 39.07 | 75.00% | 30.76 | 82.88% |
| reply to written complaints/enquiries regarding metering operations | 95% within 30 calendar days | 25.67 | 81.00% | 52.95 | 65.08% |
| NON-DOMESTIC CUSTOMERS | ARETI’S PERFORMANCE | ||||
| reply to written complaints/enquiries regarding distribution operations | 95% within 30 calendar days | 46.82 | 70.00% | 26.95 | 82.96% |
| reply to written complaints/enquiries regarding metering operations | 95% within 30 calendar days | 29.36 | 78.00% | 48.97 | 63.62% |
| MEDIUM VOLTAGE SUPPLIES (MV) | |||||
| FINAL CUSTOMERS | ARETI’S PERFORMANCE | ||||
| reply to written complaints/enquiries regarding distribution operations | 95% within 30 calendar days | 35.31 | 72.00% | 11.21 | 95.09% |
| reply to written complaints/enquiries regarding metering operations | 95% within 30 calendar days | 25.16 | 74.00% | 52.05 | 56.41% |
(*) The symbol “/” is used when services were not requested during the year, n.a. means the data are not applicable.
TABLE NO. 22 – MAIN SPECIFIC AND GENERAL LEVELS OF COMMERCIAL QUALITY – ENERGY SALES (2018-2019) – (ARERA parameters and Acea Energia performance – data submitted to ARERA)
| ENERGY SALES | |||
| SPECIFIC LEVELS OF COMMERCIAL QUALITY(*) | |||
| SERVICES | ARERA PARAMETERS MAXIMUM TIME BY WHICH THE SERVICE MUST BE PERFORMED | Percentage of services carried out within time limit | Percentage of services carried out within time limit |
| 2018 | 2019 | ||
| MORE PROTECTED SERVICE | ACEA ENERGIA’S PERFORMANCE | ||
| billing adjustments | 90 calendar days (2018) 60 calendar days (2019) | 80.0% | 50.0% |
| double billing adjustments | 20 calendar days | 100.0% | / |
| reasoned reply to written complaints | 40 calendar days (2018) 30 calendar days (2019) | 76.0% | 79.0% |
| FREE MARKET | ACEA ENERGIA’S PERFORMANCE | ||
| billing adjustments | 90 calendar days (2018) 60 calendar days (2019) | 60.0% | 40.0% |
| double billing adjustments | 20 calendar days | / | / |
| reasoned reply to written complaints | 40 calendar days (2018) 30 calendar days (2019) | 85.5% | 82.6% |
| GENERAL LEVELS OF COMMERCIAL QUALITY | |||
| SERVICES | ARERA PARAMETERS MINIMUM PERCENTAGE OF SERVICES TO BE PERFORMED WITHIN A MAXIMUM TIME | Percentage of services performed within the maximum time | Percentage of services performed within the maximum time |
| MORE PROTECTED SERVICE | ACEA ENERGIA’S PERFORMANCE | ||
| Reply to written enquiries | 95% within 30 calendar days | 99.9% | 100% |
| FREE MARKET | PERFORMANCE ACEA ENERGIA | ||
| Reply to written enquiries | 95% within 30 calendar days | 98.8% | 99.4% |
(*) The symbol “/” is used when services were not requested during the year, n.a. means the data are not applicable.
TABLE NO. 23 – SERVICE CONTINUITY DATA – ENERGY DISTRIBUTION (2017-2019) – (ARERA parameters and Areti performance – 2017-2018: data certified by ARERA; 2019: provisional data)
| ENERGY DISTRIBUTION – CONTINUITY INDICATORS – LV CUSTOMERS | |||||
| DURATION OF DISRUPTIONS AND PERCENTAGE CHANGES | |||||
| SERVICES | Average aggregate duration of lasting disruptions without prior notice under the operator’s responsibility per LV per year (minutes) | Percentage changes | |||
| 2017 | 2018 | 2019 | 2019 vs. 2017 | 2019 vs. 2018 | |
| high concentration | 34.93 | 43.61 | 43.81 | 25.4% | 0.4% |
| medium concentration | 39.51 | 50.02 | 60.15 | 52.3% | 20.3% |
| low concentration | 53.63 | 54.44 | 66.35 | 23.7% | 21.9% |
| AVERAGE NO. OF DISRUPTIONS AND PERCENTAGE CHANGES(*) | |||||
| SERVICES | Average no. of disruptions without prior notice under the operator’s responsibility per LV customer per year | Percentage changes | |||
| high concentration | 1.78 | 1.99 | 2.02 | 13.2% | 1.1% |
| medium concentration | 1.92 | 2.19 | 2.52 | 31.3% | 15.0% |
| low concentration | 2.57 | 3.01 | 3.33 | 29.3% | 10.5% |
(*) The yearly average number of disruptions per low voltage customer considers both lasting disruptions (> 3 minutes) as well as short disruptions (≤ 3 minutes but longer than 1 second)
NOTE The three territorial areas are defined on the basis of the degree of concentration of the resident population: more than 50,000 inhabitants is defined as “high concentration”; between 5,000 and 50,000 inhabitants is defined as “medium concentration”; less than 5,000 inhabitants is defined as “low concentration”.
QUALITY IN THE WATER AREA
Through subsidiaries and investee companies, the Acea Group manages the integrated water service (IWS) in several Optimal Areas of Operations (ATO) or District Areas of Lazio, Tuscany, Campania and Umbria.
Consistent with the reporting scope (see Disclosing sustainability: methodological note), below are described the activities carried out in Lazio and Campania by the following companies:
- Acea Ato 2, in OTA 2 – Central Lazio (Rome and another 111 municipalities, of which 79 managed48, equal to about 94% of the population included in the Area), the “historical” area of the Group’s operations49, with more than 3.7 million inhabitants served in 2019;
- Acea Ato 5, in OTA 5 – southern Lazio – Frosinone (86 municipalities managed50 in the area of Frosinone and vicinity, equal to about 95% of the population), for about 470,000 inhabitants served;
- Gori – in the reporting scope from this year – operating in the Sarnese-Vesuviano district (in 76 municipalities – 59 in the province of Naples and 17 in the province of Salerno – of which 74 managed), with over 1.4 million inhabitants served;
- Gesesa51, operating in OTA – Calore Irpino (22 municipalities managed, in the Benevento area and vicinity), with more than 120,000 inhabitants served52.
The four companies in question alone account for approximately 67% of the population served in the water sector throughout the Group.
The integrated water service (IWS) involves the entire cycle of drinking water and wastewater, from the collection of water from the springs until its return to the environment, and is regulated by a management agreement signed between the Company that takes charge of the service and the Area Authority (AGB – Area Governing Body). ARERA defined the minimum essential contents, uniform throughout the country, of the “Standard Agreement” that governs the relations between the entrusting bodies and the service operators. For the main regulatory interventions in the water sector undertaken during the year by ARERA, see paragraph Context analysis and business model (Group Profile chapter), and for more details see the Authority’s website.
The Integrated water service charter annexed to the Agreement defines the general and specific quality standards that the operator must respect in relation to the users, in compliance with the ARERA Resolutions on contractual quality and technical quality aspects. The User Regulations, also annexed to the Agreement govern the relationship with customers, establishing the technical, contractual and economic conditions binding on the operator in the provision of the services. For the contractual quality performances supplied by the water Companies, see sub-paragraph Levels of quality regulated by ARERA in the water segment hereunder.
The management activities of the integrated water service, while closely related and therefore allowing an optimal definition of the processes, must relate to situations that are very diversified from the standpoints of sale, demographics, geomorphology and hydrology of the regions served, which also impact on the infrastructure to be implemented. Marketing and labelling) The Companies operate in compliance with the procedures of certified management systems, in particular, for Acea Ato 2 and Acea Ato 5, in the areas of Quality, Environment, Safety and Energy, for Gori and Gesesa, in the areas of Quality, Environment and Safety (for more information see Corporate identity, Management systems).
AREAS, INTERVENTIONS AND REMOTE CONTROL
All companies are progressively digitising the networks, with studies, field surveys and data entry in the georeferenced information system (GIS). In particular, as of 31.12.2019 Acea Ato 2 has georeferenced about 85% of the networks, and Acea Ato 5 has digitised about 2,300 km of water network, as well as having almost completed the surveys on another 1,000 km (12 municipalities) and launched a four-year plan for the completion of surveys and the subsequent digitisation of the networks of all the municipalities managed. Gori and Gesesa have mapped the areas shown in table no. 24, while the surveys and updating of the data continue. Gesesa has also already georeferenced the water sites (wells, springs, reservoirs) and the sewerage and purification lifting plants, including the related functional schemes, making technical intervention more simple and effective.
TABLE NO. 24 – WATER MAINS AREAS 2019 (GEOREFERENCED DATA)
| COMPANY | DRINKING WATER NETWORK (KM) | SEWERAGE NETWORK (KM) |
| Acea Ato 2 | 12,167 (721 km of aqueduct, 1,088 km transport networks 10,358 km distribution) | 5,839 (of which over 4,000 for Rome) |
| Acea Ato 5 | 5,496 (1,205 km transport network and 4,291 km distribution network) | 1.522 |
| Gori | 4,967 (811 km supply network and 4,156 km distribution network) | 2.505 |
| Gesesa | 1,541 (166 km transport network and 1,375 km distribution network) | 553 (including emissaries, main and secondary collectors) |
The networks are connected to a complex system of equipment and plants necessary for the operations of the aqueduct, treatment and sewerage services.
Each year, the Companies carry out:
- interventions on the infrastructure, such as modernisation or strengthening of the plants, remote control of the infrastructure, completion, extension or reclamation of the pipelines and networks to contain the losses and improve the efficiency and quality of the service provided;
- interventions aimed at improving the management of user accounts (such as installation and replacement of meters), for which reference is also made to the Customer care section;
- interventions to protect people and the region aimed at ensuring the quality of the drinking water distributed and the water returned to the environment (such as the Water Safety Plans – WSPs – and laboratory controls).
Last year Acea Ato 2 laid the foundations for the construction of the new upper section of the Peschiera Aqueduct, an infrastructure that will secure the water supply for the territory of Rome and province. To this end, preparatory activities are under way for the construction of the work that will engage the Company in the coming years. Acea Ato 2 continued the installation of tools capable of optimising the pressures in the distribution network, managing their control in a dynamic and effective manner (hydraulic valves, pressure reducers, etc.). Indeed, thanks to the division of the networks into districts, the installation of 65 valves was planned for 2020. During the second half of 2019, 249 meters were mounted on small springs to improve the monitoring of the volume of collected water. About 88 km of water network were also reclaimed, activities started for the commissioning of a plant (Casa del Guardiano) in the municipality of Santa Marinella to increase water availability in the municipalities of Alumiere and Tolfa, and a generator was put in place to power the springs of Doganella, important for the supply of many municipalities of Castelli Romani.
See table no. 25 for a quantification of the main interventions and controls carried out during the year by the companies.
TABLE NO. 25 – MAIN INTERVENTIONS ON THE DRINKING WATER AND SEWERAGE NETWORKS AND CONTROLS ON DRINKING WATER AND WASTEWATER (2019)
| INTERVENTIONS ON DRINKING WATER NETWORKS, METERS AND WATER TESTS | |
| TYPE OF WORK | |
| ACEA ATO 2 | |
| Interventions due to network failure/leak detection | 23,931 interventions (22,656 due to faults, 1,275 leak detection) |
| Meter installations (new installation and replacement) | 21,407 interventions (13,937 new installations and 7,470 replacements) and approximately 88,000 mass replacements under contract |
| Network extension | 9.5 km of expanded network |
| Network reclamation | 88 km of reclaimed network |
| Drinking water quality control | 112,482 samples collected and 365,728 tests performed |
| ACEA ATO 5 | |
| Interventions due to fault | 11,367 interventions of repair |
| interventi programmati | 78 interventions (13 on the supply network and 65 on the water distribution network) |
| Meter installations (new installation and replacement) | 36,941 interventions (4,913 new installation and 32,028 replacements) |
| Network extension | 3.7 km of expanded network |
| Network reclamation | 45.5 Km of reclaimed network |
| Drinking water quality control | 2,828 samples collected and 123,790 analytical tests performed |
| GORI | |
| Interventions due to network failure/leak detection | 16,097 interventions (total, for faults and leak detection) |
| Planned interventions | 9,458 interventions (3,192 on the supply network and 6,266 on the water distribution network) |
| Meter installations (new installation and replacement) | 75,198 interventions (13,032 new installation and 62,166 replacements) |
| Network extension | 1.5 km of expanded network |
| Network reclamation | 66 Km of reclaimed network |
| Drinking water quality control | 4,374 samples collected and 109,363 tests performed |
| GESESA | |
| Interventions due to network failure/leak detection | 1,857 interventions (1,413 due to faults, 444 leak detection) |
| Planned interventions | 93 nterventions |
| Meter installations (new installation and replacement) | 2,432 interventi interventions (including new installation and replacements) |
| Network extension | 0.6 km of expanded network |
| Network reclamation | 2.6 Km of reclaimed network |
| Drinking water quality control | 336 samples prelevati e collected and 8,428 tests performed |
| INTERVENTIONS ON SEWERAGE NETWORKS AND TESTS | |
| TYPE OF WORK | |
| ACEA ATO 2 | |
| Interventions due to network failure | 5,512 interventions |
| Planned interventions | 373 interventions |
| Network extension | 5.1 km of expanded network |
| bonifica rete | 13.9 km of reclaimed network |
| controllo qualità acque reflue | 7,955 samples collected and 170,641 tests performed |
| ACEA ATO 5 | |
| Interventions due to network failure | 710 interventions |
| Planned interventions | 25 interventions |
| Network extension | 3 km of expanded network |
| Network reclamation | 3,7 km of reclaimed network |
| Wastewater quality control | 3,298 samples collected and 41,616 tests performed |
| GORI | |
| Interventions due to network failure | 681 interventions |
| Planned interventions | 1,001 interventions |
| Network extension | 7.9 km of expanded network |
| Network reclamation | 5.4 km of reclaimed network |
| Wastewater quality control | 1,203 samples collected and 21,027 tests performed |
| GESESA | |
| Interventions due to network failure | 190 interventions |
| Planned interventions | 16 interventions |
| Network extension | 0 km of expanded network |
| Network reclamation | 0.1 km of reclaimed network |
| Wastewater quality control | 395 samples collected and 5,514 tests performed on wastewater |
In Acea Ato 2, the aqueducts and the supply network are controlled remotely from a qualitative and quantitative standpoint. Remote monitoring provides information useful for knowing the status of the network and its operation (set up of the plants, status of the pumps, position of the valves, measurements, alarms and the possibility of performing remote-controlled operations).
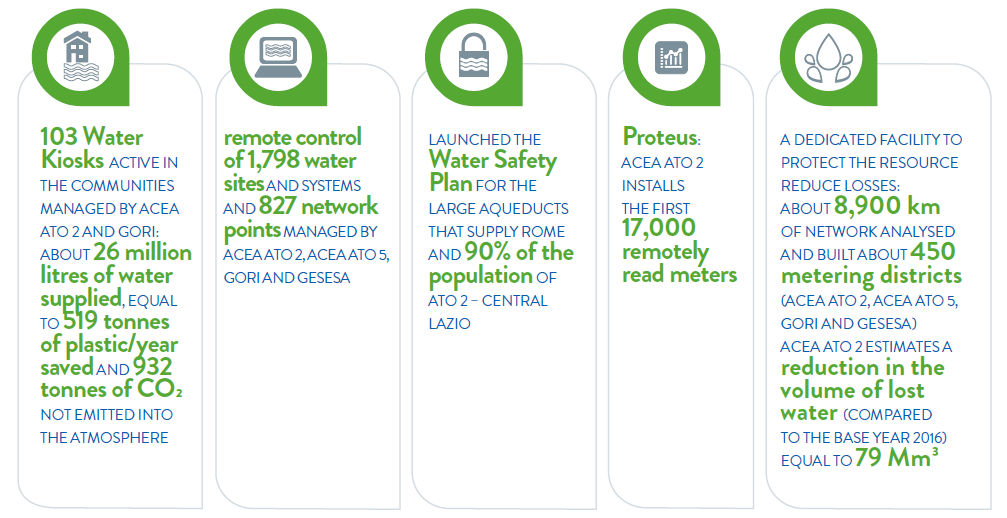
In addition, the Rome distribution network is fed by remotely controlled water centres equipped with flow and/or pressure and/ or level measurements. Thanks to the progressive implementation of the system, 738 water stations were partially or totally remotely controlled in 2019, to which 271 plants were added, including Water Kiosks, equipped with remotely controlled quality measurements and 739 network points, including 104 hydrovalves. Progressive remote control of the entire sector has also continued for the sewerage and treatment system: the main treatment plants are already controlled by on-site rooms and technological modernisation is under way to connect them to the central remote control room.
Some of the water sites managed by Acea Ato 5 – including supply sources, distribution plants, sewerage lifting plants and purification plants – are remotely controlled. In particular, both telemetry and command and control activities are carried out and hydraulic parameters are recorded (water flow, network pressure, reservoir levels, operating status of the electric pumps, with relevant electrical parameters and qualitative parameters like clearness and residue colour).
During the year, 278 sites were managed remotely (equipped with hydraulic measurement systems – flow, pressure and levels – and 15 also equipped with water quality control systems) and 88 network points (continuous pressure or flow monitoring systems).
All the plants managed by Gori relating to the water, sewerage and purification systems have been equipped with remote control systems; a total of 485 plants including 314 water, 161 sewerage and 10 purification sites, where the same activities are carried out as indicated above for Acea Ato 5.
Based on the logic of energy efficiency management and resource savings, Gori has equipped the systems with a local control system for the automatic management of the machines (electric pumps and valves installed), with human intervention required only in cases of emergency. To implement dynamic adjustments of the amount of resource delivered according to different scenarios related to situations of water crisis, valves were installed and are remotely controlled to regulate the output flow from all the major basins. In addition, in order to monitor essential network parameters (pressures and flow rates) where electricity is absent, a project is being implemented based on the use of technologies in the area of Information of Things-IoT (battery- powered measuring instruments and innovative communication protocols) for the remote control of water and sewerage network nodes that will lead to an efficiency of network pressures and leak research and an increase in the level of quality of service offered to users.
Gesesa plans to gradually expand the remote control system to the managed sites. As at 31.12.2019, there are 26 sites already equipped with the technology.
WATER PROTECTION AND SEARCH FOR LEAKS
Sustainable water management is also achieved by limiting losses from distribution networks. In 2019 the Water Companies continued their intense efforts to improve the efficiency of distribution networks, also thanks to the establishment in the Water Industrial Segment of a cross-cutting organizational structure dedicated to the protection of water and the implementation of measures to reduce losses. In addition to the network district initiatives illustrated in the box, the activities carried out in 2019 by Acea Ato 2 for the protection of water were:
- the verification and calibration of meters installed on large supply sources and the installation of MID flow meters on all “minor” sources to optimize the quality of the process measurement;
- the installation of automatic valves for dynamic control of network pressures;
- the continuation of surveys and georeferencing of managed networks;
- field actions aimed at combating abuse and misuse of resources;
- reclamation of approximately 88 km of water network (of the entire territory of the OTA 2 managed).
A CROSS-CUTTING STRUCTURE DEDICATED TO WATER PROTECTION: ACEA ATO 2 INITIATIVES AND THE DISTRICT METHODOLOGY
Thanks to the shared commitment of the Water Industrial Segment Companies, which met during the year as part of an organizational structure dedicated to the protection of the resource and the containment of leakes, it was possible to implement numerous interventions on the networks. In particular, Acea Ato 2 divided the network into areas not connected to each other and with measured inputs.
Based on water districts, the methodology makes it possible to optimize operating pressures with an immediate advantage in terms of reducing lost volumes, and thanks to the precise control on individual parts of the network allows quickly identifying and possible leaks or other anomalies and to proceed with needed actions or repairs. The application of the system produces a general improvement in the management of the network, facilitating repairs and reducing the frequency of faults. Overall, Acea Ato 2 analysed approximately 6,200 km of distribution network and created 300 measurement districts.
The activity consisted of surveys, flow and pressure measurements, map production, user analysis and water balancing, mathematical modelling and searches for leaks. The results of the study and efficiency actions were imported into the GIS systems.
The actions taken have made it possible to reduce the volume of water lost by an estimated total of about 79 million cubic metres (over 20% of the volumes lost in 2016, equal to 384 Mm3, the base year for the progressive implementation of a target for the Sustainability Plan).
Acea Ato5 has continued its study of distribution networks and created water districts (in particular in the municipalities of Atina, Cassino, Castrocielo, Colfelice, Fiuggi, Frosinone, Morolo, Serrone, Sora, Strangolagalli, Roccasecca, Patrica, Sgurgola, Supino).
After a precise reconstruction of the network and the simultaneous updating of the geographic information system (GIS), 148 districts were created, affecting approximately 1,190 km of water network. In addition, the installation of flow meters, most capable of being remote controlled, allowed rapid quantification of the input into the network, while the positioning of pressure meters at critical points allowed the identification of the most critical areas and the resolution of related problems.
The searches performed, also done using acoustic systems, identified 140 leaks, of which 40 were hidden. By dividing the network into districts and installing pressure reduction devices a savings of about 5% of the network input, equal to about 90 l/s, has been estimated.
Gori is implementing network recovery and reduction of water leaks through the regulation of the pressure thanks to the installation of dedicated valves, and each year carries out systematic searches for leaks on the water networks using specialized personnel. In particular, in 2019 a total of 71 valves were installed for pressure and flow regulation, and the search involved a total of 1,399 km of water network of the managed territory, in particular the municipalities of Casalnuovo di Napoli, Castellammare di Stabia, Anacapri, Siano, Nocera Inferiore, Lettere, Tufino, Meta Di Sorrento, Roccarainola, Angri and Gragnano.
The interventions, including the reclamation of the networks, led to a recovery of water estimated at about 193 l/s for the entire Sarnese-Vesuvian district.
In 2019 Gesesa continued the analysis of the water networks and leak detection and recovery with 110 km of network inspected and the reclamation of about 2.6 km of network. The Company is also creating network districts, progressively extending the reduction of pressures to all the municipalities managed.
UTILITY MANAGEMENT AND CONTINUITY OF SERVICE
In 2019 all the companies continued the activities of installing new meters and replacing old ones (see table no. 25). As part of its mass meter replacement, Acea Ato 2 carried out the IoT pilot project called “Development of Water Meter Remote Reading”, developing a product called “Proteus” and, as at 31.12.2019, installing approximately 17,000 meters in remote reading mode (see the box for details). Acea Ato 5, which carried out more than 10,500 interventions during the year to replace malfunctioning meters, will implement a remote reading development project similar to Acea Ato 2, with connectivity solutions and the development of a management centre headed by the Company Areti, equipped with an architecture integrated in the Acea application map. Gori carried out about 75,200 interventions on the meters during the year, most of them for their replacement, and Gesesa about 2,400 interventions.
PROTEUS FOR THE REMOTE READING OF WATER METERS: 17,000 INSTALLED IN 2019
In 2019 Acea Ato 2 continued a project in collaboration with Areti – an expert in the field of remote management of electrical meters – aimed at remotely reading the measurements detected by the water meters of the accounts managed.
A patented product called “Proteus” was developed and tested that stores the signals communicated by the device installed on the meter and converts them into readings to be sent to the Management Centre, connected to the billing systems. The radio module is equipped with an integrated battery and non-removable SIM card with GPRS or NB-IoT connectivity.
In 2019, approximately 7,000 Proteus GPRS and 10,000 Proteus NB-IoT were installed and put into operation on as many water accounts, and further evolutions of the system were developed to maximize its effectiveness and efficiency. The objective of the project is to develop increasingly effective remote reading solutions and install them on all managed water accounts. Acea Ato 5 will implement a project similar to the one already implemented in Acea Ato 2.
Once fully operational, the system will provide a more accurate and timely measurement of the volumes delivered to users, with a consequent improvement in the effectiveness of billing and water balance processes, as well as a greater awareness of consumption by users.
The continuity of the water supply is one of the fundamental service parameters for customer satisfaction, which has been subject to regulation by the ARERA. Table no. 26 shows the data of the last three years relating to disruptions and water reductions, urgent (due to accidental breakdowns of pipelines or plants, energy interruption, etc.) or planned, for the Companies in question.
TABLE NO. 26 – NUMBER, TYPE AND DURATION OF DISRUPTIONS IN THE SUPPLY OF WATER (2017-2019)
| TYPE OF DISRUPTION | 2017 | 2018 (*) | 2019 (**) |
| ACEA ATO 2 | |||
| urgent disruptions (no.) | 1,915 | 1.722 | 1,303 |
| planned disruptions (no.) | 143 | 266 | 204 |
| total disruptions (no.)(***) | 2,058 | 1,988 | 1,507 |
| suspensions lasting > 24hrs (no.) | 242 | 200 | 170 |
| ACEA ATO 5 | |||
| urgent disruptions (no.) | 303 | 552 | 428 |
| planned disruptions (no.) | 270 | 149 | 338 |
| total disruptions (no.)(***) | 573 | 701 | 766 |
| suspensions lasting > 24hrs (n.) | 6 | 2 | 0 |
| GORI | |||
| urgent disruptions (no.) | 870 | 6.708 | 1.016 |
| planned disruptions (no.) | 128 | 87 | 202 |
| total disruptions (no.)(***) | 998 | 6,795 | 1,218 |
| suspensions lasting > 24hrs (no.) | 0 | 0 | 0 |
| GESESA (****) | |||
| urgent disruptions (no.) | 100 | 106 | 107 |
| planned disruptions (no.) | 1,320 | 30 | 31 |
| total disruptions (***) | 1,420 | 136 | 138 |
| suspensions lasting > 24hrs (no.) | 22 | 18 | 3 |
(*) The 2018 figures for Acea Ato 2 have been consolidated.
(**) The 2019 data of Acea Ato 2 and Gori are still in the process of consolidation and refer to all the cases reported in the register of service disruptions required by ARERA in resolution 917/2017. Any adjustments, after data consolidation, will be reported in the next reporting cycle.
(***) Starting from the 2018 report, the data for total disruptions has been expanded, as envisaged by the Authority. It includes shutdowns (due to damage to pipes/pipelines and network changes) and the interruptions due to disruptions and system anomalies. The number of total out of service cases was therefore used for the calculation.
(****) Gesesa’s data are provisional and subject to revision and consolidation.
WATER DISTRIBUTED AND RETURNED TO THE ENVIRONMENT
The quality of the drinking water distributed is another essential factor of the service, in particular for aspects related to the health and safety of all users. The same approach applies, however, to the water returned to the receiving water bodies. Therefore, all companies independently carry out controls on drinking and wastewater using internal laboratories (for example, Gori works with the Francesco Scognamiglio laboratory) or with the support of the Acea Elabori Group Company (see table no. 25).
In particular, tests on water intended for consumption are carried out on samples collected from springs and wells, supply plants, reservoirs and along distribution networks, as well as samples collected for extraordinary testing (users, local health authority requests, etc.) and specific parameters (e.g. radioactivity). The frequency of the tests and sample collection points are defined taking into consideration volumes of water distributed, population covered, network and infrastructure conditions and specific characteristics of local springs (for these aspects see also Environmental relations).
In 2019, Acea Ato 2 launched the Water Safety Plan (WSP) of the managed aqueduct system, which will be implemented for the large aqueducts that supply, aside from Rome, 90% of the population of OTA 2 and over 200,000 inhabitants in 45 municipalities in the province of Rieti and the province of Frosinone. The Emergency Plan was also updated during the year, with the criteria complying with the guidelines of the water safety plans (see the chapter Institutions and the company). In April, Acea Ato 2 completed implementation of the WSP for the Grottarossa water purification plant that treats the waters of the Tiber in accordance with Ministerial Decree. 14/06/2017 (see also the chapter Institutions and the company and the section Relations with the environment).
In operation since October 2018, the plant contributes to increasing the Roman water system’s resilience to extreme events, which may occur as a result of climate change, and supplies water, normally used to supply the plant watering network of the City of Rome and the Vatican, that is actually suitable for human consumption and immediately available in case of emergency to supply the drinking water network at the service of 350,000 inhabitants of the central areas of Rome.
The spring water collected to supply the Rome and Fiumicino area starts from levels of excellence, while in the Castelli Romani area and other areas of northern Lazio the volcanic nature of the terrain adds mineral elements to the water such as fluorine, arsenic and vanadium, in concentrations exceeding those envisaged by the law. Acea Ato 2 has been working for some time to resolve these issues, such as by decommissioning some local sources of supply and replacing them with higher quality springs. In recent years, a number of drinking water plants were built, and in 2019 Acea Ato 2 built new ones or upgraded/expanded existing ones in the municipalities of Ariccia, Bracciano, Castel Gandolfo, Trevignano and Marino. A drinking water plant has also been acquired on which major adaptation work has been planned and started to serve the municipalities of Civitavecchia and Cerveteri.
In 2019, Gesesa carried out extraordinary checks on the presence of tetrachloroethylene in the wells serving the city of Benevento, finding a centralized lower than the threshold indicated by current legislation. Gori purchased a high resolution mass spectrometer to search for emerging pollutants. In addition, in implementation of national legislation and the Community Directives on Water Safety Plans (WSP), it has created an internal team with cross-cutting skills for the implementation of the Water Safety Plan and launched inspections on all plants.
In 2019 83 Water Kiosks were active (22 in Rome and 61 in the province), free dispensers of natural or sparkling chilled water available to the public and tourists. The water distributed is the same as the aqueducts and the quality is certified by strict regular checks conducted by Acea and the relevant local health authorities. Each Water Kiosk is fitted with a monitoring device linked to the in Acea Ato 2 remote control systems and is also equipped with USB power supply sockets for recharging devices and a screen for transmitting company/local information.
During the year, Acea Ato 2 Water Companies dispensed a total of 20,951,000 litres of water (58% sparkling water), equal to 419 tonnes of plastic saved and about 735 tonnes of CO2 not emitted into the atmosphere due to bottles not being produced53 and net of emissions due to energy consumption by the Companies and the CO2 added to produce sparkling water.
Gori also has 20 active Water Kiosks located in the managed territory, which in 2019 dispensed a total of 4,993,500 litres of water, equal to 100 tonnes of plastic saved and about 197 tonnes of CO2 not emitted into the atmosphere54.
THE PERCEIVED QUALITY OF DRINKING WATER, RESULTS OF THE 2019 SATISFACTION SURVEYS
Acea measures customer habits and perceptions regarding the quality of the drinking water supplied. Customer satisfaction surveys conducted twice yearly call for an in-depth review of this topic.
For Rome and Fiumicino, the opinion on taste, smell and clearness of the water to drink expressed by the sample of interviewees was stable compared to 2018, and the average of the two surveys was equal to 7.6/10.
Global satisfaction in the province was 6.8/10 (7.1 in 2018). In addition, 50% of the interviewees in the Capital state they normally drink tap water at home whereas 31% state they never drink it (they were respectively 52% and 29% in 2018). These percentages in the suburban areas change to 16.4% for those regularly drinking tap water (a significant decrease compared to 37.4% in 2018) and 45.1%, for those who do not (43.1 in previous surveys). Among the reasons given by those who never drink tap water, in the city the habit of drinking mineral water is still prevalent in 52% of cases.
The same reason is given in the province in 41.9% of cases, followed by poor confidence in hygiene (38.5%). For Acea Ato 5 customers in Frosinone and vicinity, the overall opinion expressed on drinking water improved in 2019 and reached 6/10 (it was 5.6/10 in 2018). The percentage of respondents stating that they habitually drink tap water remains limited at 23.9% (it was 20.1% in 2018), while still high but significantly decreasing is the percentage of those stating that they never drink it, equal to 56.7% (it was 65.3% in 2018). For the latter, the main reason given is “it is not good for my health (too much calcium, presence of minerals)” for 33.5%, while 30.3% have the habit of drinking mineral water. In the Sarnese Vesuviano district, the overall opinion on drinking water expressed in 2019 by Gori’s customers was 5.9/10 (it was 5.6/10 in 2018).
The number of interviewees stating that they habitually drink tap water remained stable, going from 24% in 2018 to 24.7% in 2019, while the percentage of those stating that they never drink it decreased more appreciably from 58.2% in 2018 to 52.2% in 2019. The main reason cited by those who do not drink tap water is “it is not good for my health”, equal to 32.1% in 2019 (it was 34.9% in 2018). For customers of Gesesa in Benevento and vicinity, customer satisfaction surveys were introduced in the second half of 2018, therefore the results of the analysis on water quality are reported as an average of the two 2019 surveys, without a precise comparison with the previous year. The overall assessment of the quality of tap water is 6.6/10. The percentage of customers stating that they regularly drink tap water is very low, 11%, while 64.3% state that they never drink it. The prevailing reason is the lack of confidence in hygiene, for 48.7%.
The collection of wastewater and its treatment prior to being returned to the environment takes place through a complex system and a configuration organized by “areas” comprising wastewater treatment plants, sewerage networks connected thereto and the associated pumping stations. Acea Ato 2 manages 709 sewerage lifting systems (220 of them in the municipality of Rome), 169 treatment plants (34 in the municipality of Rome, 5 major and 29 minor) and about 5,839 km of sewerage networks (of which over 4,000 km managed in Rome).
For the water network of the city of Rome and the Vatican, currently supplied, as mentioned, by the Grottarossa plant, in the future the water coming out of the COBIS purification plant – about 250 l/s – will be used, treated in order to make it suitable for reuse. The work of upgrading the purification plant, carried out in 2019, saw the creation of a tertiary treatment of double stage filtration and disinfection with UV rays. The plant will feed the Paolo Aqueduct through a pipeline about one kilometre long and a lifting system. The reuse of water will make it possible to save other water resources. Before using the plant to supply the non-drinking water network, to prevent any possible risk and validate the control systems the Health and Safety Plan will be completed, launched in May 2019 with the collaboration of the Control Bodies and Municipalities of the Bracciano district served by the COBIS sewage system.
At 31/12/2019 the infrastructure of the purification and sewerage service managed by Acea Ato 5 included 219 sewerage lifting plants, 132 treatment plants and over 1,500 km of dedicated networks (georeferenced data). Among the infrastructure managed by Gori, some purification plants are at the service of individual municipalities and others at the service of inter-municipal areas of the Sarnese-Vesuvian agriculture. In 2019, Gori took charge of three other district treatment plants, reaching a total of 10 managed plants (for about 1.6 million population equivalent). At 31/12/2019 the infrastructure of the purification and sewerage service managed by Gesesa included 19 sewerage lifting plants, 32 treatment plants and 553 km of dedicated networks.
The city of Benevento is not served by a centralised purification plant and the Municipality of Benevento is planning the design for its realisation and the connection outfalls. In 2019, Gesesa upgraded and secured all the purification plants managed and started revamping works on two of them: the purification plant to which the waters of the municipality of Castelpagano are conveyed and the Santa Lucia purification plant at the service of the municipality of Morcone.
As mentioned above, in the municipality of Rome Acea Ato 2 also manages the pumping stations and reservoirs for the non-drinking water network and irrigation network, which feeds major artistic fountains. In particular, 9 of the main artistic and monumental fountains of the Capital: the Triton Fountain, the three fountains in Piazza Navona – the Fountain of the Four Rivers, the Moor Fountain and the Fountain of Neptune – the Trevi Fountain, the Fountain of Turtles, the Fountain of Moses, the Fountain of the Naiads and the Acqua Paola Fountain (Paola Water Exhibition), on some of which special works have been carried out (see box for details). Acea Ato 2 is also responsible for the water segment up to the “point of delivery” for the drinking fountains and fire hydrants and intervenes in the event of damage to the water supply system and for water flow opening and closing operations.
Acea surveys parameters that specify the quality of water entering and exiting treatment plants and the impact on receiving water bodies: the Tiber and Aniene rivers (see also Relations with the environment, Water segment). The Acea Ato 2 Environmental Operations Centre, renovated in 2018, constantly monitors data recorded by remote control using avant-garde technology relating to hydrometric and rainfall information concerning the Rome area, shared with the Rome Hydrographic and Tide Gauge Operations Office, as well as data on the quality of the water of the water bodies. In 2019, 354 samples were taken at 27 sampling points on the Tiber and Aniene rivers and on Lake Bracciano.

WORKS ON THE FOUNTAINS IN ROME
In 2019 some major works were carried out on the Naiads Fountain, with the complete overhaul of the treatment system, the replacement of the recirculation electric pumps, the disassembly and overhaul of all nozzles and the complete cleaning of the fountain’s water supply lines. At the Acqua Paola Fountain the external gates were overhauled and the recirculation water treatment system was completely replaced. Finally, for the Moses Fountain a section of the recirculation system supply pipe was replaced, and repairs and replacements of pipe sections located inside the statues and marbles were carried out. On the Trevi Fountain, as mentioned above, the interventions carried out by Areti concerned the renovation of the monument’s lighting.
QUALITY LEVELS REGULATED BY ARERA IN THE WATER SECTOR
The Regulatory Authority for Energy Networks and Environment (ARERA) defines the specific and general levels of contractual quality for the water sector55. With resolution 547/19, which took issued at the end of the year, the Authority amended and supplemented the current regulations with effect from 1 January 2020, establishing an incentive system divided into bonuses and penalties to be attributed from 2022 based on the performance of the operators.
Again for 2019, therefore, Acea Ato 2 presents its performance according to levels of improvement of the contractual quality standards defined by the Authority. In fact, in 2016 ARERA accepted the request from the Area Governing Body (Mayors’ Conference of OTA 2 Central Lazio) requesting the recognition of bonuses related to meeting more challenging standards. In particular, the improvement concerns 43 indicators out of the 47 established by the resolution. The tariff related recognition of the award intervened in the year after that of the communication on performance, as far as the limits that the proposed improvement levels were reached and aggregated (see also the box relating to prizes and sanctions in the chapter Institutions and the company). In order to allow the Operational Technical Secretariat of the Area (STO) to verify performance, by January56 of each year Acea Ato 2 must produce Lists containing data on performance for the previous year. Having completed the appropriate assessments, the Technical Secretariat proceeds with quantifying the award of economic competence to the year of reference57.
The table illustrating the performance of Acea Ato 2 shows the improvements implemented by the company next to the standards provided by the ARERA, as well as, where pertinent, the average actual completion time for the services and, as prescribed, the degree of compliance of the improvement standard. The 2019 performance of Acea Ato 2 (see table no. 27) shows an average compliance greater than 90%, the indicators relating to the execution of complex works and the water connection with complex works show room for improvement, while excellent results were achieved for the following services: transfers, responses to complaints/requests, response to the emergency call, punctuality for appointments, execution of simple works, estimates and execution of water connections with simple works.
For certain services envisaged by the Service Charter annexed to the Convention Agreement, Acea Ato 5 also achieved results that were higher than the standards imposed by the Authority (see table no. 28). The Companies Acea Ato 5, Gori and Gesesa comply with the deadlines for submitting performance data established by ARERA (March 2020), so here it is possible to publish the available estimates of the 2019 performance data, to be understood as indicative of their performance. In contrast, the final 2018 data are published and submitted to the Authority. In some cases, the 2019 performance estimates of Acea Ato 5 show improvement compared to the 2018 final performance, such as responses to complaints and written requests for information and billing adjustments. For other indicators, the percentage related to the degree of compliance drops, for example, for activations and deactivations of the supply.
For Gori, the estimates of 2019 contractual quality performance (see table no. 29) improve compared to 2018, in particular for the services relating to the response to complaints and written requests as well as the activation of the supply, while some compliance percentages fall, especially for the execution of complex works and water and sewerage connections with complex works. Also with regard to Gesesa the performance estimates for the year (see table no. 30) show some improvements, for example for the activation of the supply, the estimates for on-site works and the execution of complex works, while other services, including the execution of simple works and the response to complaints, have lower ratings.
Resolution 655/2015 provides for a mechanism of automatic indemnities to be granted to customers in the event of off-standard services related to the specific indicators. The unit value of the compensation varies according to the delay in the execution of the service58. Overall, in 2019 the Companies paid automatic indemnities to customers amounting to approximately € 1 million (for details see the box that illustrates investigations, bonuses and penalties in the chapter Institutions and the company).
As required by the Authority, Water Companies communicate performance data to users in bills once a year59, and at the moment only Acea Ato 2 and Acea Ato 5 disseminate these online as well (www. gruppo.acea.it). Finally, all Companies publish the information on the quality of drinking water on their websites.
TABLE N. 27 –THE MAIN SPECIFIC AND GENERAL LEVELS OF CONTRACTUAL QUALITY IN THE WATER SEGMENT (2018-2019) – ACEA ATO 2 – (ARERA parameters, Acea Ato 2 improvement standards and performance – data submitted to the STO)
| CONTRACTUAL QUALITY WATER SEGMENT – ACEA ATO 2 | |||||||||||
| SPECIFIC LEVELS OF QUALITY | |||||||||||
| SERVICES | ARERA STANDARD | ACEA ATO 2 IMPROVEMENT STANDARD | Service delivery average actual time | Degree of compliance | Service delivery average actual time | Degree of compliance | |||||
| ACEA ATO 2 PERFORMANCE | |||||||||||
| 2018 | 2019 | ||||||||||
| estimate for water connection with inspection | 20 working days | 15 working days | 9.5 | 90.3% | 7 | 95.5% | |||||
| estimate for sewage connection with inspection | 20 working days | 15 working days | / | / | / | / | |||||
| execution of the water connection with simple work | 15 working days | 10 working days | 13.5 | 73.1% | 5.3 | 95.8% | |||||
| execution of the sewage con simple work | 20 working days | 15 working days | / | / | / | / | |||||
| supply activation | 5 working days | 3 working days | 12.9 | 74.1% | 4.7 | 90.5% | |||||
| reactivation or takeover of the supply without changing the meter rate | 5 working days | 3 working days | 2.0 | 92.3% | 1.8 | 95.7% | |||||
| reactivation or takeover supply with changes to the meter rate | 10 working days | 6 working days | 1.3 | 100% | 3 | 80.0% | |||||
| reactivation of supply following disconnection for late payment | 2 weekdays | 1 weekday | 1.2 | 87.6% | 0.7 | 94.2% | |||||
| deactivation of supply | 7 working days | 3 working days | 5.4 | 91.9% | 2.6 | 95.8% | |||||
| transfer of registration | 5 working days | 3 working days | 0 | 99.8% | 0.1 | 99.9% | |||||
| estimates for works with inspection | 20 working days | 15 working days | 11.6 | 90.3% | 8.2 | 93.0% | |||||
| completion of simple work | 10 working days | 6 working days | 4.3 | 42.9% | 3.6 | 100.0% | |||||
| fpunctuality band for appointments | 180 minutes | 120 minutes | 1,0 | 96.0% | 1.2 | 99.0% | |||||
| reply to complaints | 30 working days | 20 working days | 7,3 | 99.2% | 12.1 | 97.4% | |||||
| rreply to written enquiries | 30 working days | 20 working days | 8,9 | 98.3% | 9.4 | 98.1% | |||||
| billing adjustment | 60 working days | 55 working days | 7 | 99.1% | 5.2 | 100.0% | |||||
| GENERAL LEVELS OF QUALITY | |||||||||||
| PERFORMANCE ACEA ATO 2 | |||||||||||
| 2018 | 2019 | ||||||||||
| completion of complex water connection | 90% of the services within 30 working days | 90% of the services within 20 working days | 25.2 | 70.5% | 20.2 | 78.6% | |||||
| completion of complex sewage connection | 90% of the services within 30 working days | 90% of the services within 25 working days | / | / | / | / | |||||
| completion of complex works | 90% of the services within 30 working day | 90% of the services within 20 working days | 41.9 | 47.6% | 30.4 | 63.5% | |||||
| maximum time for the agreed appointment | 90% of the services within 30 working days | 90% of the services within 5 working days | 3.5 | 90.2% | 2.8 | 97.5% | |||||
| arrival at the location of the emergency call | 90% of the services within 3 hours from the telephone conversation with the operator | 90% of the services within 2 hours from the telephone conversation with the operator | 21.9 | 62.2% | 3.3 | 91.0% | |||||
| reply to written billing adjustment requests | 95% of the services within 30 working days from receipt of the request | 95% of the services within 20 working days from receipt of the request | 7.0 | 99.1% | 9.7 | 98.5% | |||||
| reply to the emergency call (CPI) | 90% of the services within 120 seconds | 90% of the services within 110 seconds | 63.1 | 95.1% | 48 | 98.1% | |||||
The symbol “/” is used when there have been no services during the year, whereas “-” indicates that the average time cannot be calculated because the services is on/off.
TABLE NO. 28 – MAIN SPECIFIC AND GENERAL LEVELS OF CONTRACTUAL QUALITY IN THE WATER SECTOR (2018- 2019) – ACEA ATO 5 – (ARERA parameters, higher standards than the Service Charter, and Acea Ato 5 performance – 2018: final data, 2019: estimated data, in the validation phase – ARERA reporting scheduled for March 2020)
| CONTRACTUAL QUALITY WATER SEGMENT – ACEA ATO 5 | ||||||
| SPECIFIC LEVELS OF QUALITY | ||||||
| SERVICES | ARERA STANDARD | ACEA ATO 5 IMPROVEMENT STANDARD (FROM SERVICE CHARTER) | Service delivery average actual time | Degree of compliance | Service delivery average actual time | Degree of compliance |
| PERFORMANCE ACEA ATO 5 | ||||||
| 2018 | 2019 | |||||
| estimate for water connection with inspection | 20 working days | 10 working days | 4.2 | 97.8% | 7.8 | 83.3% |
| estimate for sewage connection with inspection | 20 working days | 10 working days | 4.5 | 99.0% | 9.9 | 94.9% |
| execution of the water connection with simple WORK | 15 working days | 4.2 | 96.8% | 2.8 | 93.8% | |
| execution of the sewage connection simple work | 20 working days | 23.0 | 50.0% | 35.5 | 67.0% | |
| supply activation | 5 working days | 6.7 | 80.0% | 8.6 | 61.3% | |
| reactivation or takeover of the supply without changing the meter rate | 5 working days | 1.8 | 99.0% | 2.3 | 94.6% | |
| reactivation or takeover supply with changes to the meter rate (*) | 10 working days | n.a. | n.a. | n.a. | n.a. | |
| reactivation of supply following disconnection for late payment (*) | 2 working days | n.a. | n.a. | n.a. | n.a. | |
| deactivation of supply | 7 working days | 5 working days | 2.9 | 96.6% | 4.0 | 88.0% |
| transfer of registration | 5 working days | 0.2 | 99,6% | 0.4 | 99.1% | |
| estimates for works with inspection | 20 working days | 4.7 | 99.0% | 9.1 | 81.7% | |
| completion of simple work | 10 working days | 9.8 | 69.8% | / | / | |
| punctuality band for appointments | 180 minutes | 1.6 | 99.0% | 2.4 | 99.4% | |
| reply to complaints | 30 working days | 20 working days | 6.8 | 89.2% | 7.6 | 96.8% |
| reply to written enquiries | 30 working days | 10 working days | 12.9 | 69.6% | 13.0 | 92.5% |
| billing adjustment | 60 working days | 11.5 | 77.1% | 5.9 | 98.5% | |
| GENERAL LEVELS OF QUALITY | ||||||
| ACEA ATO 5 PERFORMANCE | ||||||
| 2018 | 2019 | |||||
| completion of complex water connection | 90% of the the services within 30 working days | 90% of the services within 20 working days | 7.8 | 92.6% | 13.0 | 97.0% |
| completion of complex sewage connection | 90% of the services within 30 working days | 90% of the services within 20 working days | 12.0 | 67.0% | 13.0 | 66.7% |
| completion of complex works | 90% of the services within 30 working days | 13.2 | 93.9% | 10.8 | 94.8% | |
| maximum time for the agreed appointment | 90% of the services within 7 working days | 3.4 | 98% | 5.3 | 83.8% | |
| arrival at the location of the emergency call | 90% of the services within 3 hours from the telephone conversation with the operator | 90% of the services within 70 min from the telephone conversation with the operator | 50.0 | 100% | 62.4 | 89.6% |
| reply to written billing adjustment requests | 95% of the services within 30 working days from receipt of the request | 95% of the services within 10 working days from receipt of the request | 17.2 | 53.8% | 13.0 | 76.0% |
| reply to the emergency call (CPI) | 90% of the services within 120 seconds | 65.9 | 96.3% | 65.2 | 92.1% | |
(*) In these two cases the standard does not apply as the Company does not foresee “reactivation” but rather termination and the creation of a new contract. The symbol “/” is used when there have been no services during the year, whereas “-” indicates that the average time cannot be calculated because the services is on/off.
TABLE NO. 29 – MAIN SPECIFIC AND GENERAL LEVELS OF CONTRACTUAL QUALITY IN THE WATER SECTOR (2018-2019) – GORI – (ARERA parameters and Gori performance – 2018: final data, 2019: estimated data, in the validation phase – ARERA reporting scheduled for March 2020)
| CONTRACTUAL QUALITY WATER SEGMENT – GORI | |||||
| SPECIFIC LEVELS OF QUALITY | |||||
| SERVICES | ARERA STANDARD | Service delivery average actual time | Degree of compliance | Service delivery average actual time | Degree of compliance |
| GORI PERFORMANCE | |||||
| 2018 | 2019 | ||||
| estimate for water connection with inspection | 20 working days | 5.2 | 98.7% | 7.7 | 99.4% |
| estimate for sewage connection with inspection | 20 working days | 6.5 | 97.4% | 11.7 | 98.0% |
| execution of the water connection with simple work | 15 working days | 47.3 | 60.0% | 35.9 | 30.8% |
| execution of the sewage connection with simple work | 20 working days | 242.5 | 0.0% | 15.0 | 100% |
| supply activation | 5 working days | 7.4 | 72.7% | 6.2 | 84.3% |
| reactivation or takeover of the supply without changing the meter rate | 5 working days | 4.0 | 89.9% | 2.9 | 93.7% |
| reactivation or takeover of the supply with changes to the meter rate | 10 working days | 3.5 | 100% | / | / |
| reactivation of supply following disconnection for late payment | 2 weekdays | 1.1 | 97.2% | 0.6 | 99.5% |
| deactivation of supply | 7 working days | 4.6 | 88.9% | 5.0 | 92.2% |
| transfer of registration | 5 working days | 0.3 | 98,2% | 0.4 | 98.6% |
| estimates for works with inspection | 20 working days | 8.2 | 96.8% | 11.5 | 99.7% |
| completion of simple work | 10 working days | 53.2 | 25.0% | 37.6 | 20.0% |
| punctuality band for appointments | 180 minutes | 1.7 | 98.3% | 1.7 | 99.1% |
| reply to complaints | 30 working days | 30.6 | 79.9% | 16.7 | 89.8% |
| reply to written enquiries | 30 working days | 37.3 | 80.2% | 8.5 | 96.3% |
| billing adjustment | 60 working days | 104.0 | 0% | 18.0 | 100% |
| GENERAL LEVELS OF QUALITY | |||||
| GORI PERFORMANCE | |||||
| 2018 | 2019 | ||||
| completion of complex water connection | 90% of the services within 30 working days | 35,1 | 72.7% | 35.9 | 63.3% |
| completion of complex sewage connection | 90% of the services within 30 working days | 38,7 | 64.5% | 44.1 | 49.1% |
| completion of complex works | 90% of the services within 30 working days | 27,1 | 75.4% | 30.9 | 65.7% |
| maximum time for the agreed appointment | 90% of the services within 7 working days | 4,6 | 91.9% | 4.3 | 92.7% |
| arrival at the location of the emergency call | 90% of the services within 3 minutes from the telephone conversation with the operator | 2,5 | 95.8% | 1.7 | 94.3% |
| reply to written billing adjustment requests | 95% of the services within 30 working days from receipt of the request | 19,8 | 88.3% | 9.1 | 97.7% |
| reply to the emergency call (CPI) | 90% of the services within 120 seconds | 79,1 | 91.2% | 68.0 | 92.6% |
The symbol “/” is used when there have been no services during the year, whereas “-” indicates that the average time cannot be calculated because the services is on/off.
Tabella n. 30- TABLE NO. 30 – MAIN SPECIFIC AND GENERAL LEVELS OF CONTRACTUAL QUALITY IN THE WATER SECTOR (2018-2019) – GESESA – (ARERA parameters, and Gesesa performance – 2018: final data, 2019: estimated data, in the validation phase – ARERA reporting scheduled for March 2020)
| CONTRACTUAL QUALITY WATER SEGMENT – GORI | ||||||
| SPECIFIC LEVELS OF QUALITY | ||||||
| SERVICES | ARERA STANDARD | Service delivery average actual time | Degree of compliance | Service delivery average actual time | Degree of compliance | |
| GESESA PERFORMANCE | ||||||
| 2018 | 2019 | |||||
| estimate for water connection with inspection | 20 working days | 3.7 | 99.4% | 4.9 | 100% | |
| estimate for sewage connection with inspection | 20 working days | / | / | / | / | |
| execution of the water connection with simple work | 15 working days | 19.5 | 65.0% | 17.6 | 60.7% | |
| execution of the sewage connection with simple work | 20 working days | / | / | / | / | |
| supply activation | 5 working days | 49.0 | 40.0% | 26.7 | 72.7% | |
| reactivation or takeover of the supply without changing the meter rate | 5 working days | 3.7 | 98.0% | 6.6 | 95.6% | |
| reactivation or takeover of the supply with changes to the meter rate | 10 working days | / | / | / | / | |
| reactivation of supply following disconnection for late payment | 2 weekdays | 0.5 | 100% | 0.7 | 97.5% | |
| deactivation of supply | 2 weekdays | 10.34 | 96.3% | 11.4 | 98.3% | |
| transfer of registration | 5 working days | 1.2 | 96.8% | 0.7 | 98.3% | |
| estimates for works with inspection | 20 working days | 4.1 | 96.6% | 5.0 | 100% | |
| completion of simple work | 10 working days | 7.2 | 72.7% | 10.7 | 50.0% | |
| punctuality band for appointments | 180 minutes | 114 | 92.2% | 96 | 91.7% | |
| reply to complaints | 30 working days | 24.7 | 87.5% | 28.4 | 69.6% | |
| Reply to written enquiries | 30 working days | 25.7 | 92.1% | 24.1 | 96.1% | |
| billing adjustment | 60 working days | / | / | / | / | |
| GENERAL LEVELS OF QUALITY | ||||||
| GESESA PERFORMANCE | ||||||
| 2018 | 2019 | |||||
| completion of complex water connection | 90% of the services within 30 working days | 33.8 | 69.6% | 27.2 | 75% | |
| completion of complex sewage connection | 90% of the services within 30 working days | / | / | / | / | |
| completion of complex works | 90% of the services within 30 working days. | 28.9 | 75.0% | 23.3 | 86.2% | |
| maximum time for the agreed appointment | 90% of the services within 7 working days | 2.2 | 98.1% | 2.0 | 98.4% | |
| arrival at the location of the emergency call | 90% of the services within 3 minutes from the telephone conversation with the operator | / | / | / | / | |
| reply to written billing adjustment requests | 95% of the services within 30 working days from receipt of the request | / | / | / | / | |
| reply to the emergency call (CPI) | 90% of the services within 120 seconds | - | 84.5% | - | 85% | |
The symbol “/” is used when there have been no services during the year, whereas “-” indicates that the average time cannot be calculated because the services is on/off.
35 Areti holds the ministerial concession for the distribution of electricity in the areas indicated and manages public lighting under the Service Contract stipulated between Acea SpA and Roma Capitale.
36 By Resolution of the City Council No. 130 dated 22 December 2010 regarding the Updating of the Service Agreement between Roma Capitale and Acea SpA, effective 15 March 2011, the agreement was extended to 31/12/2027.
37 For the purpose of calculating service levels, reports pertaining to damages caused by third parties are not be considered.
38 Fines are calculated using the following criteria: each repair completed beyond the TMAX will be sanctioned; repairs completed within the TMAX but exceeding the TMRA will be sanctioned only if TMR>TMRA. At the time of publication of this document the data is not yet definitive, therefore the accurate data on 2019 reports subject to fines being calculated is not available.
39 More detailed information on call centre performance and written complaints is provided in the Customer Care section.
40 The data excludes reminders and repeated reporting of the same fault.
41 “Specific quality standards” are defined as the deadline within which the service provider must provide a given service and, in the event of non-compliance, they require that automatic compensation is granted to customers; the general quality standards” are defined as the minimum percentage of services to be provided within a given deadline.
42 Due to the misalignment between the delivery times of reports to the Authority and those required by law for the publication of this document.
43 Where due, automatic compensation is paid to the customer by deduction from the amount charged in the first subsequent bill and if needed in following bills, or paid by direct remittance. In any case, such automatic compensation must always be paid to the customer within 6 months from the date of receipt of the written complaint or the request for reimbursement of double billing, with the exception of customers who are billed quarterly, for which the term is set at 8 months. Compensation for distribution is paid to customers by deducting the amount from the bill or by issuing a cheque within 30 days of the date of the service in question or, at the latest, by three times the period of standard time established for such service, excluding automatic compensation for failure to comply with the punctuality range for appointments, in respect of which the time will commence on the date of the appointment.
44 The amount currently set by the Authority for compensation for non-compliance with the specific quality standards for the distribution service starts from a basic amount of € 35 for domestic low voltage customers; € 70 for non-domestic low voltage customers and € 140 for medium voltage customers. In the event of non-compliance with the specific quality standards of the sale, the seller shall pay the final customer an automatic compensation of € 25. The indemnity increases in relation to the delay in the execution of the service: if it takes place beyond the standard but within twice the time limit, the basic automatic compensation is paid; if in more than twice the time but within three times the standard, twice the basic automatic compensation is paid; finally, if the execution of the service occurs beyond three times the standard, triple the basic automatic compensation is paid.
45 Resolution 646/15/R/eel as amended.
46 Due to the misalignment between the delivery times of reports to the Authority and those required by law for the publication of this document.
47 In order to be entitled to compensation, medium voltage customers must prove that they have installed protection devices at their plants that can prevent any interruption caused by faults within their utility plants from having repercussions on the network, damaging other customers connected nearby. Furthermore, in order to access compensation customers will be required to have arranged for the distribution company to receive a plant adequacy statement issued by parties with specific technical and professional expertise. Failure by customers to meet the requirements whereby compensation may be sought will cause the amount of the compensation to turn into a fine, which the distribution company is required to transfer to the Energy and Environmental Services Fund.
48 In 79 municipalities, equal to about 94% of the population in OTA 2 – Central Lazio, Acea Ato 2 managed the entire IWS (aqueduct, sewerage and waste water treatment), and the IWS was partially managed in another 18 municipalities.
49 Acea was entrusted with the running of the capital’s aqueduct service since 1937, the water treatment system since 1985 and the entire sewerage system since 2002, effective 1 January 2003.
50 Including the management of two municipalities outside the area (Conca Casale and Rocca d’Evandro).
51 It should be noted that Gesesa has corrected the data relating to the population served in the last three years.
52 These are the main Companies of the Acea Group, operating in the water sector in Italy and consolidated in the financial statements using the line-by-line method (100% Acea SpA). The other companies operating in Tuscany, Umbria and Campania, owned by Acea, are consolidated using the equity method – with the exception of AdF, which entered the scope in the last quarter of 2019 – consequently they are not included in the reporting scope, with the exception of certain global data aimed at representing the general dimension of the Group, as specified in the text from time to time (see also Relations with the environment and the Environmental accounts, as well as the chapter, outside of the scope of the NFS pursuant to Legislative Decree 254/2016, Water company data sheets and overseas activities).
53 This figure is underestimated as it does not consider the saving in emissions due to bottles not being transported by road/railway.
54 In the absence of precise data on the CO2 added, the 2019 calculation of CO2 not emitted into the atmosphere thanks to the use of Gori Water Kiosks was calculated assuming that only still water was dispensed.
55 For most of the services the regulation of contractual quality aspects is in force from July 2016 according to resolution 655/15/R/Idr or RQSII (Regulation of the contractual quality of the integrated water service).
56 In advance of the deadline of the end of March established by resolution 655/15.
57 In January 2019 Acea Ato 2 sent the STO the 2018 data related to the performance of contractual quality, and following verification the Secretariat calculated a bonus of about € 33.6 million.
58 The unit value indemnity is € 30, € 60 or € 90 according to whether the service is completed in a time less than double the standard, in a time ranging between double and triple the standard, or in triple or more than triple time with respect to the standard. Overall, the Water Companies in the scope paid automatic compensation during the year.
59 The obligation to notify all end customers of the levels of quality achieved in the previous year in the bill by 30 June is in force (art. 78.1 Resolution 655/2015).